1. 第一种方法:工具调试
1.1. ps -ef 查看进程号
[root@local]# ps -ef |grep test

root 967496 967456 99 09:57 ? 00:06:52 /usr/bin/test-controller-cn -conf /etc/tester/config.yaml
root 970312 964216 0 09:59 pts/29 00:00:00 grep --color=auto test
1.1. ps -eLF 查看进程对应线程,采用的CPU核心号
- -e 或者-A,选择所有的进程
- L 显示线程信息
- F 显示该线程使用CPU核心序号
# 其中Nov07前面的几位核心序号
$ ps -eLF |head -n 1
UID          PID    PPID     LWP  C NLWP    SZ   RSS PSR STIME TTY          TIME CMD

$ ps -eLF |grep gobgpd
root      389417  282141  389417  0    1 53282   888  35 00:07 pts/0    00:00:00 grep --color=auto gobgpd
root     3382205       1 3382205  0    1 53460  3264  33 Nov07 ?        00:00:00 /bin/sh -c env GOTRACEBACK=crash /usr/bin/gobgpd -t yaml -f /etc/vnet/gobgpd.yaml >> /var/log/vnet/gobgpd/gobgpd.log 2>&1
root     3382206 3382205 3382206  0   56 181805 37716  3 Nov07 ?        00:00:00 /usr/bin/gobgpd -t yaml -f /etc/vnet/gobgpd.yaml
root     3382206 3382205 3382207  0   56 181805 37716 58 Nov07 ?        00:17:55 /usr/bin/gobgpd -t yaml -f /etc/vnet/gobgpd.yaml
root     3382206 3382205 3382208  0   56 181805 37716 63 Nov07 ?        02:05:01 /usr/bin/gobgpd -t yaml -f /etc/vnet/gobgpd.yaml
root     3382206 3382205 3382209  0   56 181805 37716 37 Nov07 ?        00:00:00 /usr/bin/gobgpd -t yaml -f /etc/vnet/gobgpd.yaml
root     3382206 3382205 3382210  0   56 181805 37716 60 Nov07 ?        02:00:16 /usr/bin/gobgpd -t yaml -f /etc/vnet/gobgpd.yaml
root     3382206 3382205 3382211  0   56 181805 37716  3 Nov07 ?        00:00:00 /usr/bin/gobgpd -t yaml -f /etc/vnet/gobgpd.yaml
1.2. top -H -p 查看系统占用
$top -H -p 967496

 top -H -p 967496 top - 09:58:31 up 110 days, 23:23, 3 users, load average: 16.65, 16.49, 16.71
 Threads: 12 total, 4 running, 8 sleeping, 0 stopped, 0 zombie
 %Cpu(s): 22.9 us, 3.7 sy, 0.0 ni, 73.2 id, 0.0 wa, 0.1 hi, 0.1 si, 0.0 st
 MiB Mem : 514204.7 total, 23595.1 free, 467343.5 used, 23266.0 buff/cache
 MiB Swap: 0.0 total, 0.0 free, 0.0 used. 39131.6 avail Mem

 PID USER PR NI VIRT RES SHR S %CPU %MEM TIME+ COMMAND
 967503 root 20 0 1135088 218492 17648 R 83.7 0.0 0:40.56 test-controller-
 967507 root 20 0 1135088 218492 17648 S 81.0 0.0 0:42.94 test-controller-
 967499 root 20 0 1135088 218492 17648 R 79.7 0.0 0:45.88 test-controller-
 967506 root 20 0 1135088 218492 17648 R 79.0 0.0 0:34.51 test-controller-
 967502 root 20 0 1135088 218492 17648 R 74.3 0.0 0:42.36 test-controller-
 967497 root 20 0 1135088 218492 17648 S 1.0 0.0 0:00.57 test-controller-
 967496 root 20 0 1135088 218492 17648 S 0.0 0.0 0:00.00 test-controller-
 967498 root 20 0 1135088 218492 17648 S 0.0 0.0 0:39.01 test-controller-
1.3. dlv attach 查看调用堆栈
[root@local]# dlv attach 967503

[root@local]# (dlv)goroutines  #罗列所有协程

[root@local]# (dlv)goroutine 967503   #切换到967503协程

[root@local]# (dlv) bt  # 查看调用堆栈

[root@local]# (dlv) vars  # 查看变量

Running the program:
    call ------------------------ Resumes process, injecting a function call (EXPERIMENTAL!!!)
    continue (alias: c) --------- Run until breakpoint or program termination.
    next (alias: n) ------------- Step over to next source line.
    rebuild --------------------- Rebuild the target executable and restarts it. It does not work if the executable was not built by delve.
    restart (alias: r) ---------- Restart process.
    step (alias: s) ------------- Single step through program.
    step-instruction (alias: si)  Single step a single cpu instruction.
    stepout (alias: so) --------- Step out of the current function.

Manipulating breakpoints:
    break (alias: b) ------- Sets a breakpoint.
    breakpoints (alias: bp)  Print out info for active breakpoints.
    clear ------------------ Deletes breakpoint.
    clearall --------------- Deletes multiple breakpoints.
    condition (alias: cond)  Set breakpoint condition.
    on --------------------- Executes a command when a breakpoint is hit.
    toggle ----------------- Toggles on or off a breakpoint.
    trace (alias: t) ------- Set tracepoint.
    watch ------------------ Set watchpoint.

Viewing program variables and memory:
    args ----------------- Print function arguments.
    display -------------- Print value of an expression every time the program stops.
    examinemem (alias: x)  Examine raw memory at the given address.
    locals --------------- Print local variables.
    print (alias: p) ----- Evaluate an expression.
    regs ----------------- Print contents of CPU registers.
    set ------------------ Changes the value of a variable.
    vars ----------------- Print package variables.
    whatis --------------- Prints type of an expression.

Listing and switching between threads and goroutines:
    goroutine (alias: gr) -- Shows or changes current goroutine
    goroutines (alias: grs)  List program goroutines.
    thread (alias: tr) ----- Switch to the specified thread.
    threads ---------------- Print out info for every traced thread.

Viewing the call stack and selecting frames:
    deferred --------- Executes command in the context of a deferred call.
    down ------------- Move the current frame down.
    frame ------------ Set the current frame, or execute command on a different frame.
    stack (alias: bt)  Print stack trace.
    up --------------- Move the current frame up.

Other commands:
    config --------------------- Changes configuration parameters.
    disassemble (alias: disass)  Disassembler.
    dump ----------------------- Creates a core dump from the current process state
    edit (alias: ed) ----------- Open where you are in $DELVE_EDITOR or $EDITOR
    exit (alias: quit | q) ----- Exit the debugger.
    funcs ---------------------- Print list of functions.
    help (alias: h) ------------ Prints the help message.
    libraries ------------------ List loaded dynamic libraries
    list (alias: ls | l) ------- Show source code.
    source --------------------- Executes a file containing a list of delve commands
    sources -------------------- Print list of source files.
    transcript ----------------- Appends command output to a file.
    types ---------------------- Print list of types
1.4. strace
Linux下,进程不能直接访问硬件设备。当进程需要访问硬件设备时(读取磁盘文件、接收网络数据等),则必须由用户态切换为内核态,然后通过系统调用来访问硬件设备。strace是跟踪进程执行时的系统调用和所接收的信号(即它跟踪到一个进程产生的系统调用,包括参数、返回值、执行消耗的时间)。strace 最简单的用法是执行一个指定的命令(过程中,starce会记录和解析命令进程的所有系统调用及这个进程的所有的信号值),在指定命令结束后立即退出。
-c 统计每一系统调用的所执行的时间,次数和出错的次数等.
-d 输出strace关于标准错误的调试信息.
-f 跟踪由fork调用所产生的子进程.
-ff 如果提供-o filename,则所有进程的跟踪结果输出到相应的filename.pid中,pid是各进程的进程号.
-F 尝试跟踪vfork调用.在-f时,vfork不被跟踪.
-h 输出简要的帮助信息.
-i 输出系统调用的入口指针.
-q 禁止输出关于脱离的消息.
-r 打印出相对时间关于,,每一个系统调用.
-t 在输出中的每一行前加上时间信息.
-tt 在输出中的每一行前加上时间信息,微秒级.
-ttt 微秒级输出.
-T 显示每一调用所耗的时间.
-v 输出所有的系统调用.一些调用关于环境变量,状态,输入输出等调用由于使用频繁,默认不输出.
-V 输出strace的版本信息.
-x 以十六进制形式输出非标准字符串
-xx 所有字符串以十六进制形式输出.
-a column 设置返回值的输出位置.默认 为40.
-e expr 指定一个表达式,用来控制如何跟踪.格式:[qualifier=][!]value1[,value2]...
qualifier只能是 trace,abbrev,verbose,raw,signal,read,write其中之一.value是用来限定的符号或数字.默认的 qualifier是 trace.感叹号是否定符号.例如:-eopen等价于 -e trace=open,表示只跟踪open调用.而-etrace!=open 表示跟踪除了open以外的其他调用.有两个特殊的符号 all 和 none. 注意有些shell使用!来执行历史记录里的命令,所以要使用\\.
-e trace=set 只跟踪指定的系统 调用.例如:-e trace=open,close,rean,write表示只跟踪这四个系统调用.默认的为set=all.
-e trace=file 只跟踪有关文件操作的系统调用.
-e trace=process 只跟踪有关进程控制的系统调用.
-e trace=network 跟踪与网络有关的所有系统调用.
-e strace=signal 跟踪所有与系统信号有关的系统调用.
-e trace=ipc 跟踪所有与进程通讯有关的系统调用.
-e abbrev=set 设定strace输出的系统调用的结果集.-v 等于abbrev=none.默认为abbrev=all.
-e raw=set 将指定的系统调用的参数以十六进制显示.
-e signal=set 指定跟踪的系统信号.默认为all.如 signal=!SIGIO(或者signal=!io),表示不跟踪SIGIO信号.
-e read=set 输出从指定文件中读出 的数据.例如: -e read=3,5 -e write=set 输出写入到指定文件中的数据.
-o filename 将strace的输出写入文件filename
-p pid 跟踪指定的进程pid.
-s strsize 指定输出的字符串的最大长度.默认为32.文件名一直全部输出.
-u username 以username的UID和GID执行被跟踪的命令
[root@local]# strace -cp 1000613
strace: Process 1000613 attached
s^Cstrace: Process 1000613 detached
% time seconds usecs/call calls errors syscall
------ ----------- ----------- --------- --------- ----------------
90.98 17.319217 150601 115 15 futex
4.54 0.863947 19 44832 2 read
4.47 0.851691 18 44832 2 write
0.01 0.001778 84 21 getrandom查看出调用futex过高
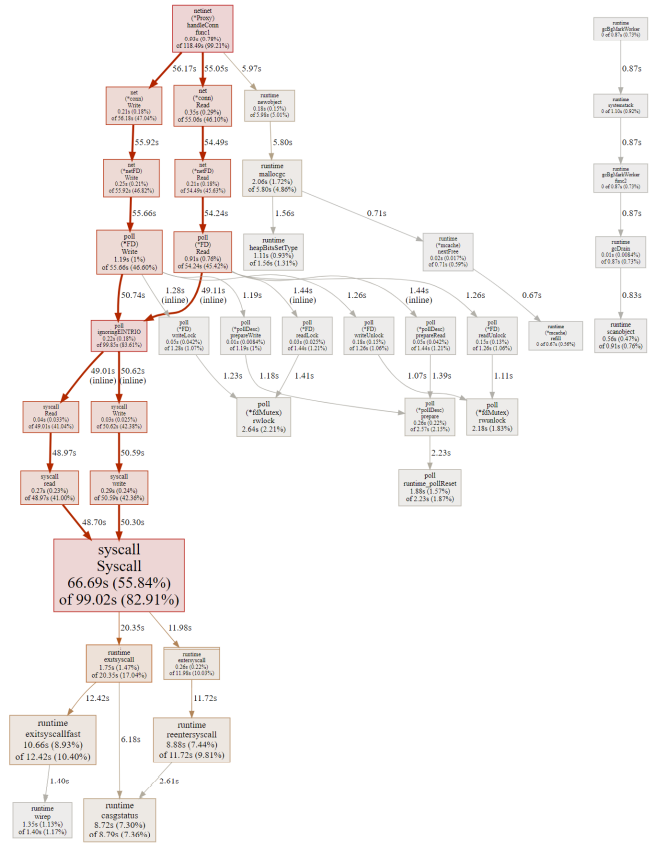
2. 第二种方法 pprof: 代码中打印调用堆栈
代码中加入包和代码
import (
    //...
    //Add:
    "net"
    "net/http"
    _ "net/http/pprof"
    //...
)

func main(){
    //运行正常业务服务
    s.ListenAndServe(ctx,url)
    //...
    // Add: pprof 为了获取程序运行时信息,临时增加分析后可注释掉
    go func(){
        log.Println(http.ListenAndServer(":6080",nil))
    }()
    //...
}